Tag: Information

  • Characteristics of MIS Management Information Systems

    Characteristics of MIS Management Information Systems

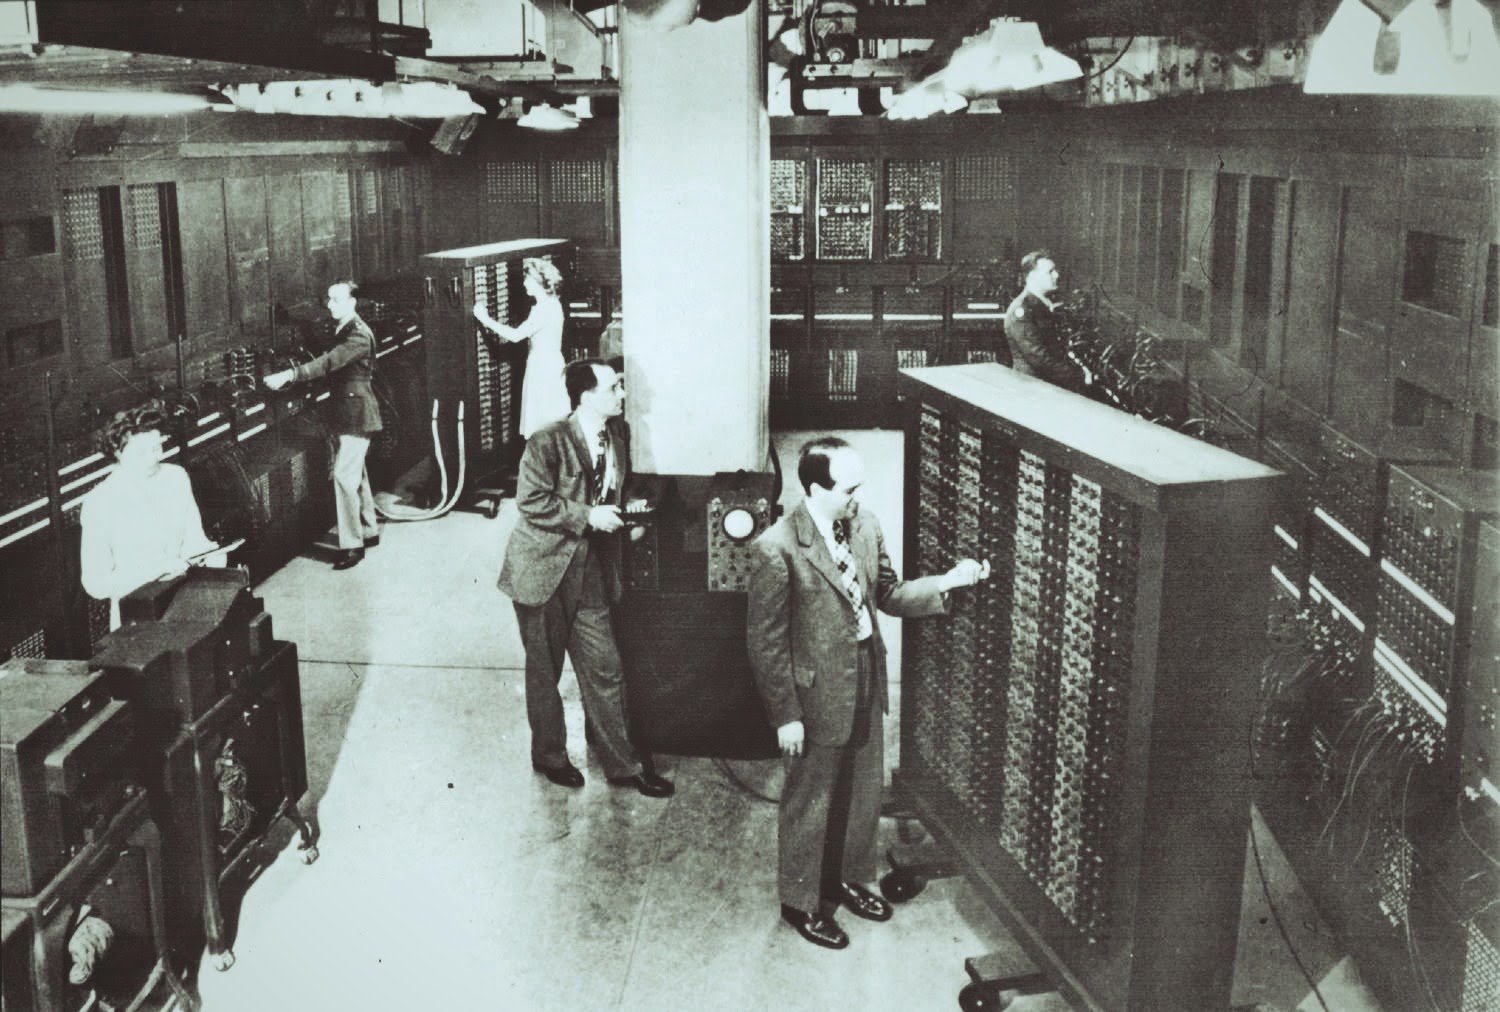
    Characteristics of MIS (Management information systems). It is a set of systems that helps management at different levels to take better decisions by providing the necessary information to managers, for long-term planning. The management information system is not a monolithic entity but a collection of systems that provide the user with a monolithic feel as far as relevant information delivery, transmission and storage are concerned. Also learned, the Role of The MIS, and its Characteristics!

    Learn, Explain the Characteristics of Management Information Systems (MIS)! 

    The different subsystems working in the background have different objectives but work in concert with each other to satisfy the overall requirement of managers for good quality information. Management information systems can install by either procuring off the self-systems or by commissioning a completely customized solution.

    A management information system has the following characteristics:

    System approach:

    The information system follows a System approach. The system’s approach implies a holistic approach to the study of the system and its performance to achieve the objective for which it has stood formed.

    Management-oriented:

    For designing MIS top-down approach should follow. The top-down approach suggests that system development starts from the determination of the management needs and overall business objectives. Management-oriented characteristic of MIS also implies that the management actively directs the system development efforts.

    Need-based:

    MIS design and development should be as per the information needs of managers at different levels that are strategic planning level, management control level, and operational control level.

    Exception-based:

    MIS should develop with the exception-based reporting principle. This means an abnormal situation, that is the maximum, minimum or expected values vary beyond the limits. In such cases, there should be exceptions reporting to the decision-maker at the required level.

    Future-oriented:

    Besides exception-based reporting, MIS should also look at the future. In other words, MIS should not merely provide past or historical information. Rather it should provide information based on projections based on which actions may initiate.

    Integrated:

    Integration is significant because of its ability to produce more meaningful information. For example, to develop an effective production scheduling system, it is necessary to balance such factors as set-up costs, workforce, overtime rates, production capacity, inventory level, capital requirements, and customer services. Integration means taking a comprehensive view of the subsystems that operate within the company.

    Common data flows:

    Because of the integration concept of MIS, there is an opportunity to avoid duplication and redundancy in data gathering, storage, and dissemination. System designers are aware that a few key source documents account for much of the information flow. For example, customer’s orders are the basis for billing the customer for the goods ordered, setting up accounts receivables, initiating production activity, sales analysis, sales forecasting, etc.

    The Following Characteristics of Good Management Information Systems Explained!

    For information to be useful to the decision maker, it must have certain characteristics and meet certain criteria.

    Some of the characteristics of good information discuss as follows:

    Understandable:

    Since information is already in a summarized form, it must understand by the receiver so that he will interpret it correctly. He must be able to decode any abbreviations, shorthand notations, or any other acronyms contained in the information.

    Relevant:

    Information is good only if it is relevant. This means that it should be pertinent and meaningful to the decision maker and should be in his area of responsibility.

    Complete:

    It should contain all the facts that are necessary for the decision maker to satisfactorily solve the problem at hand using such information. Nothing important should stand left out. Although information cannot always be complete, every reasonable effort should make to obtain it.

    Available:

    Information may be useless if it is not readily accessible ‘ in the desired form when it needs. Advances in technology have made information more accessible today than ever before.

    Reliable:

    The information should count on being trustworthy. It should be accurate, consistent with facts, and verifiable. Inadequate or incorrect information generally leads to decisions of poor quality. For example, sales figures that have not stood adjusted for returns and refunds are not reliable.

    Concise:

    Too much information is a big burden on management and cannot process in time and accurately due to “bounded rationality”. Bounded rationality determines the limits of the thinking process which cannot sort out and process large amounts of information. Accordingly, information should be to the point and just enough – no more, no less.

    Timely:

    The information must deliver at the right time and in the right place to the right person. Premature information can become obsolete or forgotten by the time it stands needed.

    Similarly, some crucial decisions can delay because proper and necessary information is not available in time, resulting in missed opportunities. Accordingly, the time gap between the collection of the central database and the presentation of the proper information to the decision maker must reduce as much as possible.

    Cost-effective:

    The information is not desirable if the solution is more costly than the problem. The cost of gathering data and processing it into information must weigh against the benefits derived from using such information.

    The Characteristics of Management Information Systems (MIS) - ilearnlot
    Characteristics of MIS Management Information Systems
  • Role of the Management Information System (MIS)!

    Role of the Management Information System (MIS)!

    Learn and Understand, Role of the Management Information System (MIS)! 


    The role of the MIS in an organization can be compared to the role of the heart in the body. The information is the blood and MIS is the heart. In the body, the heart plays the role of supplying pure blood to all the elements of the body including the brain. The heart works faster and supplies more blood when needed. It regulates and controls the incoming impure blood, processes it and sends it to the destination in the quantity needed. Also learned, What is MIS? Role of the Management Information System (MIS)!

    It fulfills the needs of blood supply to the human body in the normal course and also in crisis. The MIS plays exactly the same role in the organization. The system ensures that an appropriate data is collected from the various sources, processed, and sent further to all the needy destinations. The system is expected to fulfill the information needs of an individual, a group of individuals, the management functionaries: the managers and the top management.

    The MIS satisfies the diverse needs through a variety of systems such as Query Systems, Analysis Systems, Modelling Systems and Decision Support Systems the MIS helps in Strategic Planning, Management Control, Operational Control and Transaction Processing.

    The MIS helps the clerical personnel in the transaction processing and answers their queries on the data pertaining to the transaction, the status of a particular record and references on a variety of documents. The MIS helps the junior management personnel by providing the operational data for planning, scheduling, and control, and helps them further in decision making at the operations level to correct an out of control situation.

    If the gathered information is irrelevant than decision will also incorrect and Organization may face big loss & lots of Difficulties in Surviving as well.

    Helps in Decision making:

    Management Information System (MIS) plays a significant Role in Decision making Process of any Organization. Because in Any organization decision is made on the basis of relevant Information and relevant information can only be Retrieving from the MSI.

    Helps in Coordination among the Department:

    Management Information System also helps in establishing a sound Relationship among every person of the department to the department through proper exchanging of Informations.

    Helps in Finding out Problems:

    As we know that MIS provides relevant information about every aspect of activities. Hence, If any mistake is made by the management then Management Information Systems (MIS) Information helps in Finding out the Solution of that Problem.

    Helps in Comparison of Business Performance:

    MIS store all Past Data and information in its Database. That why management information system is very useful to compare Business organization Performance. With the help of Management information system (MIS) Organization can analyze his Performance means whatever they do last year or Previous Years and whatever business performance in this year and also measures organization Development and Growth.

    The MIS helps the middle management, in short, them planning, target setting and controlling the business functions. It is supported by the use of the management tools of planning and control. The MIS helps the top management in goal setting, strategic planning and evolving the business plans and their implementation.

    The MIS plays the role of information generation, communication, problem identification and helps in the process of decision making. The MIS, therefore, plays a vital role in the management, administration, and operations of an organization.

    Role of the Management Information System (MIS) - ilearnlot


  • What is Management Information System (MIS)?

    What is Management Information System (MIS)?

    Learn and Study, What is Management Information System (MIS)?


    Management information system, or MIS, broadly refers to a computer-based system that provides managers with the tools to organize, evaluate and efficiently manage departments within an organization. In order to provide past, present and prediction information, a management information system can include software that helps in decision making, data resources such as databases, the hardware resources of a system, decision support systems, people management and project management applications, and any computerized processes that enable the department to run efficiently. Also learn, Concept of Investment, What is Management Information System (MIS)?

    Loader Loading…
    EAD Logo Taking too long?

    Reload Reload document
    | Open Open in new tab

    Download [56.83 KB]

    What is MIS? MIS is the use of information technology, people, and business processes to record, store and process data to produce information that decision makers can use to make day to day decisions. MIS is the acronym for Management Information Systems. In a nutshell, MIS is a collection of systems, hardware, procedures and people that all work together to process, store, and produce information that is useful to the organization.

    #Management Information System Definition:

    The Management Information System (MIS) is a concept of the last decade or two. It has been understood and described in a number of ways. It is also known as the Information System, the Information and Decision System, the Computer-based information System.

    A management information system (MIS) is a broadly used and applied term for a three-resource system required for effective organization management. The resources are people, information, and technology, from inside and outside an organization, with top priority given to people. The system is a collection of information management methods involving computer automation (software and hardware) or otherwise supporting and improving the quality and efficiency of business operations and human decision making.

    As an area of study, MIS is sometimes referred to as information technology management (IT management) or information services (IS). Neither should be confused with computer science.

    The MIS has more than one definition, some of which are given below.
    1. The MIS is defined as a system which provides information support for decision making in the organization.
    2. The MIS is defined as an integrated system of man and machine for providing the information to support the operations, the management and the decision-making functions in the organization.
    3. The MIS is defined as a system based on the database of the organization evolved for the purpose of providing information to the people in the organization.
    4. The MIS is defined as a Computer-based Information System.

    Though there are a number of definitions, all of them converge on one single point, i.e., the MIS is a system to support the decision-making function in the organization. The difference lies in defining the elements of the MIS. However, in today s world MIS a computerized .business processing system generating information for the people in the organization to meet the information needs decision making to achieve the corporate objective of the organization.

    In any organization, small or big, a major portion of the time goes in data collection, processing, documenting it to the people. Hence, a major portion of the overheads goes into this kind of unproductive work in the organization. Every individual in an organization is continuously looking for some information which is needed to perform his/her task. Hence, the information is people-oriented and it varies with the nature of the people in the organization.

    The difficulty in handling these multiple requirements of the people is due to a couple of reasons. The information is a processed product to fulfill an imprecise need of the people. It takes time to search the data and may require a difficult processing path. It has a time value and unless processed on time and communicated, it has no value. The scope and the quantum of information are individual-dependent and it is difficult to conceive the information as a well-defined product for the entire organization. Since the people are instrumental in any business transaction, a human error is possible in conducting the same. Since a human error is difficult to control, the difficulty arises in ensuring a hundred percent quality assurance of information in terms of completeness, accuracy, validity, timeliness and meeting the decision making needs.

    In order to get a better grip on the activity of information processing, it is necessary to have a formal system which should take care of the following points:

    • Handling of a voluminous data.
    • Confirmation of the validity of data and transaction.
    • Complex processing of data and multidimensional analysis.
    • Quick search and retrieval.
    • Mass storage.
    • Communication of the information system to the user on time.
    • Fulfilling the changing needs of the information.

    The management information system uses computers and communication technology to deal with these points of supreme importance.

    Why the Need for MIS?

    The following are some of the justifications for having an MIS system:

    Decision makers need information to make effective decisions. Management Information Systems (MIS) make this possible.

    MIS systems facilitate communication within and outside the organization: Employees within the organization are able to easily access the required information for the day to day operations. Facilitates such as Short Message Service (SMS) & Email make it possible to communicate with customers and suppliers from within the MIS system that an organization is using.

    Record keeping: Management information systems record all business transactions of an organization and provide a reference point for the transactions.

    What is Management Information System (MIS) - ilearnlot


  • What is Distributed Data Processing (DDP)?

    What is Distributed Data Processing (DDP)?

    What is Distributed Data Processing (DDP)?


    An arrangement of networked computers in which data processing capabilities are spread across the network. In DDP, specific jobs are performed by specialized computers which may be far removed from the user and/or from other such computers. This arrangement is in contrast to ‘centralized’ computing in which several client computers share the same server (usually a mini or mainframe computer) or a cluster of servers. DDP provides greater scalability, but also requires more network administration resources.

    Understanding of Distributed Data Processing (DDP)


    Distributed database system technology is the union of what appear to be two diametrically opposed approaches to data processing: database system and computer network technologies. The database system has taken us from a paradigm of data processing in which each application defined and maintained its own data to one in which the data is defined and administered centrally. This new orientation results in data independence, whereby the application programs are immune to changes in the logical or physical organization of the data. One of the major motivations behind the use of database systems is the desire to integrate the operation data of an enterprise and to provide centralized, thus controlled access to that data. The technology of computer networks, on the other hand, promotes a mode of that work that goes against all centralization efforts. At first glance, it might be difficult to understand how these two contrasting approaches can possibly be synthesized to produce a technology that is more powerful and more promising than either one alone. The key to this understanding is the realization that the most important objective of the database technology is integration, not centralization. It is important to realize that either one of these terms does not necessarily imply the other. It is possible to achieve integration with centralization and that is exactly what at distributed database technology attempts to achieve.

    The term distributed processing is probably the most used term in computer science for the last couple of years. It has been used to refer to such diverse system as multiprocessing systems, distributed data processing, and computer networks. Here are some of the other term that has been synonymous with distributed processing distributed/multi-computers, satellite processing /satellite computers, back-end processing, dedicated/special-purpose computers, time-shared systems and functionally modular system.

    Obviously, some degree of the distributed processing goes on in any computer system, ever on single-processor computers, starting with the second-generation computers, the central processing. However, it should be quite clear that what we would like to refer to as distributed processing, or distributed computing has nothing to do with this form of distribution of the function of function in a single-processor computer system. Web Developer’s Workflow Become Much Easier with this Innovative Gadgets.

    A term that has caused so much confusion is obviously quite difficult to define precisely. The working definition we use for a distributed computing systems states that it is a number of autonomous processing elements that are interconnected by a computer network and that cooperate in performing their assigned tasks. The processing elements referred to in this definition is a computing device that can execute a program on its own.

    One fundamental question that needs to be asked is: Distributed is one thing that might be distributed is that processing logic. In fact, the definition of a distributed computing computer system give above implicitly assumes that the processing logic or processing elements are distributed. Another possible distribution is according to function. Various functions of a computer system could be delegated to various pieces of hardware sites. Finally, control can be distributed. The control of execution of various task might be distributed instead of being performed by one computer systems, from the view of distributed instead of being the system, these modes of distribution are all necessary and important. Strategic Role of e-HR (Electronic Human Resource).


    A distributed computing system can be classified with respect to a number of criteria. Some of these criteria are as follows: degree of coupling, an interconnection structure, the interdependence of components, and synchronization between components. The degree of coupling refers to a measure that determines closely the processing elements are connected together. This can be measured as the ratio of the amount of data exchanged to the amount of local processing performed in executing a task. If the communication is done a computer network, there exits weak coupling among the processing elements. However, if components are shared we talk about strong coupling. Shared components can be both primary memory or secondary storage devices. As for the interconnection structure, one can talk about those case that has a point to point interconnection channel. The processing elements might depend on each other quite strongly in the execution of a task, or this interdependence might be as minimal as passing message at the beginning of execution and reporting results at the end. Synchronization between processing elements might be maintained by synchronous or by asynchronous means. Note that some of these criteria are not entirely independent of the processing elements to be strongly interdependent and possibly to work in a strongly coupled fashion.

    What-is-Distributed-Data-Processing-DDP


  • What is Agile Methodology?

    What is Agile Methodology?

    What do you Mean about Agile Methodology?


    First, know about What is Agile? Agile has been the buzzword in project management for about a decade, and with good reason. Agile is actually an umbrella term over several project management approaches that are characterized by their ability to allow project teams to respond to changing requirements and priorities by using incremental work packages. While all agile methods have common characteristics, each agile method has unique processes that set it apart. Let’s look at how each method is used with Charlie’s team, who is developing a new software game. What is Agile Methodology? 

    Agile software development methodology is a process for developing software (like other software development methodologies Waterfall model, V-Model, Iterative model etc.) However, Agile methodology differs significantly from other methodologies. In English, Agile means ‘ability to move quickly and easily’ and responding swiftly to change – this is a key aspect of Agile software development as well.

    Agile-Methodology-process

    “Agile Development” is an umbrella term for several iterative and incremental software development methodologies. The most popular agile methodologies include Extreme Programming (XP), Scrum, Crystal, Dynamic Systems Development Method (DSDM), Lean Development, and Feature-Driven Development (FDD). Learning Development and Exercise of Self-Efficacy Over the Lifespan!

    Engineering methodologies required a lot of documentation thereby causing the pace of development to slow down considerably. Agile Methodologies evolved in the 1990s to significantly eliminate this bureaucratic nature of engineering methodology. It was part of developer’s reaction against “heavyweight” methods, who desired to drift away from traditional structured, bureaucratic approaches to software development and move towards more flexible development styles. They were called the ‘Agile’ or ‘Light Weight’ methods and were defined in 1974 by Edmonds in a research paper.

    An agile methodology is an approach to project management, typically used in software development. It refers to a group of software development methodologies based on iterative development. Requirements and solutions evolve through cooperation between self-organizing cross-functional teams, without concern for any hierarchy or team member roles. It promotes teamwork, collaboration, and process adaptability throughout the project life-cycle with increased face-to-face communication and a reduced amount of written documentation.

    Agile methods break tasks into small increments with no direct long-term planning. Every aspect of development is continually revisited throughout the lifecycle of a project by way of iterations (also called sprints). Iterations are short time frames (“timeboxes”) that normally last 1-4 weeks. This “inspect-and-adapt” approach significantly reduces both development costs and time to market. Each iteration involves working through a complete software development cycle characterized by planning, requirements analysis, design, coding, unit testing, and acceptance testing. This helps minimize overall risk and quicker project adaptability. While iteration may not have enough functionality necessary for a market release, the aim is to be ready for a release (with minimal bugs) at the end of each iteration.

    Typically, the team size is small (5-9 people) to enable easier communication and collaboration. Multiple teams may be required for larger developmental efforts which may also require a coordination of priorities across teams. Agile methods emphasize more face-to-face communication than written documents when the team is in the same location. However, when a team works at different locations, daily contact is maintained through video conferencing, e-mail, etc. The progress made in terms of the work done today, work scheduled for tomorrow and the possible roadblocks are discussed among the team members in brief sessions at the end of each working day. Besides, agile developmental efforts are supervised by a customer representative to ensure alignment between customer needs and company goals. New Roles of Human Resource Management in Business Development.

    Software Development was initially based on coding and fixing. That worked well for smaller software, but as the size and complexities of software grew a need for a proper process was felt because the debugging and testing of such software became extremely difficult. This gave birth to the Engineering Methodologies. The methodologies became highly successful since it structured the software development process. One of the most popular models that emerged was the Software Development Life Cycle (SDLC) that developed information systems in a very methodical manner.Waterfall method is one of the most popular examples of Engineering or the SDLC methodology. A paper published by Winston Royce in 1970 introduced it as an idea. It was derived from the hardware manufacture and construction strategies that were in practice during the 1970s. The relationship of each stage to the others can be roughly described as a waterfall, where the outputs from a specific stage serve as the initial inputs for the following stage. During each stage, additional information is gathered or developed, combined with the inputs, and used to produce the stage deliverables. It is important to note that the additional information is restricted in scope; “new ideas” that would take the project in directions not anticipated by the initial set of high-level requirements are not incorporated into the project. Rather, ideas for new capabilities or features that are out-of-scope are preserved for later consideration.

    What-is-Agile-Methodology


  • Case Study of the MasterCard Credit Cards Business

    Case Study of the MasterCard Credit Cards Business

    MasterCard Credit Cards Business Case Study; Credit (change) cards have been very big business for several decades. In 2001, over $30 trillion in payments for goods and services were charging using credit cards. The cards have made life easier for many people; because, they do not need to carry large amounts of cash for most purchases. Many people also use the cards as a way to borrow money; because, they need only pay a small percentage of the amount they owe each month, although they usually charge very high-interest rates for the unpaid balance.

    Case Study of the MasterCard Credit Cards Business!

    MasterCard More info: “Mastercard Incorporated (stylized as MasterCard) is an American multinational financial services corporation headquartered in the MasterCard International Global Headquarters, Purchase, New York, United States, in Westchester County. The Global Operations Headquarters is located in O’Fallon, Missouri, United States, a suburb of St. Louis, Missouri.

    Throughout the world, its principal business is to process payments between the banks of merchants; and, the card-issuing banks or credit unions of the purchasers who use the “Mastercard” brand debit and credit cards to make purchases, their Case Study. Mastercard Worldwide has been a public trade company since 2006. Before its initial public offering, MasterCard Worldwide was a cooperative own by the more than 25,000 financial institutions that issue its branded cards.”

    The interest goes to the issuing bank, making credit cards a very profitable service for them. However, the credit card industry is intensely competitive, highly fragmented, and growing at a rate of 3 to 4 per year, making those profits difficult to achieve.

    Visa and MasterCard:

    Visa and MasterCard are associations of banks that issue credit cards, you understand their Case Study. They market their cards, often several different cards, and provide support for the transactions; making networks available to collect and use the data. The most popular credit card has been Visa, with 44.5 percent of the business in 2001; while MasterCard is number two with 31.6 percent. Being very much second to Visa, MasterCard is trying to overtake it.

    While it had been number two since the beginning, MasterCard began to emerge from “its doldrums” in 1997, according to Robert Selander, MasterCard’s CEO. It began to realize it might really be able to overtake Visa and become number one. To reach that goal, MasterCard needed to present itself so that the potential user will choose a MasterCard rather than a Visa. It also had to spur the bank issuers to promote MasterCard cards rather than those of their competition.

    In 1998, when MasterCard had only 28.8 percent of the credit card charge volume; while Visa’s was over 50 percent, MasterCard decided it needs a new computer center; partially to handle all the data as the company’s business expanded as a result of its drive to overtake Visa. It also foresaw growth as a result of its change in strategy. The company’s new strategy required a system that would be able to keep a record of every transaction of every customer for three years.

    Strategy:

    The strategy included ways MasterCard and its member banks could use that data to increase their credit card business. MasterCard wanted to increase its daily volume of 30 million transactions in 1977. At the time it had three separate computer centers on four floors in the suburbs of St. Louis, Missouri, and it wants to consolidate the computer centers while enlarging the new center; so, that it would be able to handle both the current volume and the planned volume as it expands.

    At that time it was storing nearly 50 terabytes (50 trillion numbers and letters) of data, including the dollar amount, merchant, location, and card number. MasterCard also planned to add other data fields, such as ZIP codes, to make the data more useful. However, to protect MasterCard users, it did decide not to include demographic data such as incomes and ages.

    Nonetheless, “The credit card business lives and dies by data”, said Ted Iacobuzio, director of consumer credit research for the consulting and research firm, TowerGroup. Top searched case study [Market Research Coffee of “Starbucks” Entry into China].

    Warehousing:

    While both Visa and MasterCard had already been warehousing so much data; they were both moving toward providing reports to their member banks. MasterCard’s goal was to give its members (the banks) direct access to their customers’ data as well as tools to analyze all of this data; all to persuade the banks to choose MasterCard over Visa.

    For example, if banks could use MasterCard tools to improve their analysis of the profitability of the cards in their portfolios or gain more customers and transactions to process; they would be inclined to push MasterCard more often. Such an analysis could help banks determine the types of customers that were most profitable or find ways to appeal to more potential MasterCard customers.

    Many banks issue both Visa Cards and MasterCard cards (sometimes several of each); and, if the banks can use this information from MasterCard while Visa does not have or make available such information; the MasterCard company can gain a strategic advantage.

    For example, in 2001, MasterCard persuaded Citigroup, the largest issuer of credit cards, to push MasterCard over Visa so that 85 percent of its credit cards came from MasterCard versus only 15 percent from Visa. J. P. Morgan Chase likewise was convinced to use MasterCard for 80 percent of the cards it issued.

    What is the Hope?

    MasterCard hoped it could persuade banks to use these data; if they could see the value (increased profit) in the process. Joseph Caro, MasterCard’s vice president of Internet technology services, says that “little percentages” can be very profitable to banks. In one case, a bank was requiring its merchants to verify the whole process by using the telephone to call in one transaction out of 50 for approval (rather than using a telecommunications method); while most banks were requiring only one transaction in 500.

    Because call-ins cost about $3 each, that bank could save $300,000 a year by switching over to the one in 500 methods. Another bank was turning down one transaction out of five because so many call-ins were timing out. The bank was able to discover that most of the customers turn down were actually creditworthy. By changing its set up, the bank would be able to eliminate thousands of unnecessarily lost transactions.

    About 28,000 banks and financial service companies issue MasterCard credit cards. To draw these customers into using its credit card transaction data; MasterCard needed not only to make each bank’s data available to them but also needed to make available appropriate analytic software. MasterCard assigned 35 full-time developers to the task of identifying and creating software tools to accomplish this task.

    Objects:

    Drawing on Business Objects Web Intelligence software in 2001; these developers created and programmed 27 tools for the banks to use. (These tools are not free and they are not available to merchants.) One of MasterCard’s new tools, called the Business Performance Intelligence, is for operational reporting and includes a suite of 70 standard reports that banks can use to analyze their daily, weekly, or monthly transaction.

    The banks can then compare the results from one market (such as a United States state or region, or a single country) with that of another market. MasterCard also works with individual banks to create their own custom reports, enabling them to concentrate on their own issues and concern. Subscribing banks access the MasterCard business intelligence system via a secure extranet.

    The developers also created MarketScope; which are applications that have the goal of helping banks and merchants work together to generate more purchases from the merchants if they pay for by MasterCard. One example they give is to enable Wal-Mart stores to determine how many MasterCard holders spend $25 or more on sporting goods in January and February.

    Systems development:

    Then, MasterCard’s vice president of systems development, Andrew Clyne, suggested that Wal-Mart could send these card-holders the right to obtain tickets to their closest major league baseball team based upon future sporting goods purchase above a certain dollar minimum. Lacobuzio said that such a strategy should appeal to state and regional banks. However, he believes it is likely that national and international banks would have already developed and are using their own analytical software.

    But even they would have a use for MasterCard’s software as a kind of benchmark against; which to measure the effectiveness of their own systems. Moreover, despite the increasing volume, the processing was much faster. As Caro said, “If we can do things faster, little percentages start moving in our direction.”

    Visa, however, is not sitting still and is managing about 100 trillion terabytes of data for its clients. Until recently, it mainly supplied the data online or on disks to its bank customers; who used their own software and computers to analyze the data. Recently, Visa started to run analyses for the banks on its own computers.

    Web service:

    In May 2002, Visa also introduced a Web service called Resolve Online to help banks deal with disputed payments and is working on providing banks with online analytic tools. “If MasterCard is ahead of the game in any of this”, says Iacobuzio, Visa “will have it in six months”.

    MasterCard’s new data storage site, which was opening in May 2002, is also in St. Louis, in a single 525,000-square – foot building. The complex, which was built on open land, cost MasterCard $135 million. The changeover to the new site happened over a weekend with almost no problem; despite the purchases of about $4 billion each day.

    Case Study of the MasterCard Credit Cards Business
    Case Study of the MasterCard Credit Cards Business, MasterCard Logo since July 14, 2016.
  • What is RFID (Radio Frequency Identification)? Meaning and Definition!

    What is RFID (Radio Frequency Identification)? Meaning and Definition!

    Learn, RFID (Radio Frequency Identification), Meaning and Definition!


    Radio Frequency Identification (RFID) In past few recent years, the automatic identification techniques have become quite more than popular and they have also find their places into the core of service industries, manufacturing companies, aviation, clothing, transport systems and much more. And, it’s pretty clear by this point of time that the automated identification technology especially RFID, is highly helpful in providing information regarding the timings, location and even more intense information about people, animals, goods etc. in transit. RFID is responsible for storage of large amount of data and is reprogrammable also as in contrast with its counterpart barcodes automatic identification technology.

    #Meaning of RFID!

    “Radio-frequency identification (RFID) uses electromagnetic fields to automatically identify and track tags attached to objects. The tags contain electronically stored information. Passive tags collect energy from a nearby RFID reader’s interrogating radio waves. Active tags have a local power source such as a battery and may operate at hundreds of meters from the RFID reader. Unlike a barcode, the tag need not be within the line of sight of the reader, so it may be embedded in the tracked object. RFID is one method for Automatic Identification and Data Capture (AIDC).”

    In everyday life, the most common form of an electronic data-carrying device if often a smartcard which is probably based upon the contact field. But, this kind of a contact oriented card is normally impractical and less flexible to use. On the contrary, if we think of a contactless card with contactless data transferring capabilities, it would be far more flexible. This communication happens between the data carrying device and its reader. Now, this situation may further appear as ideal if it so happens that the power for the data carrying device comes from the reader by making use of the contactless technology. Because of this specific kind of power transferring and data carrying procedures, the contactless automatic identification systems are termed as Radio frequency Identification Systems.

    What is Radio Frequency Identification (RFID)?

    Definition: The term RFID stands for Radio Frequency Identification. Radio stands for invocation of the wireless transmission and propagation of information or data. For operating RFID devices, Frequency defines spectrum, may it be low, high, ultra high and microwave, each with distinguishing characteristics. Identification relates to identify the items with the help of various codes present in a data carrier (memory-based) and available via radio frequency reading. The RFID is a term which is used for any device that can be sensed or detected from a distance with few problems of obstruction. The invention of RFID term lies in the origin of tags that reflect or retransmit a radio-frequency signal. RFID makes use of radio frequencies to communicate between two of its components namely RFID tag and the RFID reader. The RFID system can be broadly categorized according to the physical components of frequency and data.

    Physical components of the RFID system include, but are not limited to, the following: numerous RFID tags and RFID readers and Computers. The factors associated with the RFID tags are the kind of power source its has, the environment in which it operates, the antenna on the tag for communication with the reader, its corresponding standard, memory, logic applied on the chip and application methods on the tag. The RFID tag refers to a tiny radio device also known as radio barcode, transponder or smart label. This tag is comprised of a simple silicon microchip which is attached to a small flat antenna and mounted on a substrate.

    The entire device can then be encapsulated in various materials dependent upon its intended usage. The finished RFID tag can then be attached to an object, typically an item, box or pallet. This tag can then be read remotely to ascertain position, identity or state of an item. The application methods of an RFID tag may take the forms attached, removable, embedded or conveyed. Further, the RFID tags depend upon the power source which may be a battery in case of active-tags and an RFID reader in case of passive tags. In context of the environment in which the tag operates, the role of temperature range and the humidity range comes into picture.

    The RFID reader is also referred as interrogator or scanner. Its purpose is to send and receive RF data from tags. The RFID reader factors include its antenna, polarization, protocol, interface and portability. The antenna for communication in case of the RFID reader may be internal or external and its ports may assume the values single or multiple. The polarization in case of an RFID reader may be linear or circular and single or multiple protocols may be used. In an RFID reader, Ethernet, serial, Wi-Fi, USB or other interfaces may be used. Regarding portability associated with the reader, it may be fixed or handheld.

    Apart from the RFID tags and readers, host computers are also amongst the part of the physical components of an RFID system. The data acquired by the RFID readers is passed to the host computer which may further run a specialist RFID software, or middleware to filter the data and route it to the correct application to be processed into useful information.

    Apart from the physical components of an RFID system, the RFID system may be perceived from the frequency perspective. In RFID systems, the frequency may further be classified according to the signal distance, signal range, reader to tag, tag to reader and coupling. The signal distance includes the read range and the write range. The signal range here in case of RFID systems reflects the various frequency bands i.e. LF, HF, UHF and Microwave. Further, the reader to tag frequency may assume single frequency or multiple frequencies. In case of tag to reader frequency, it may be subharmonic, harmonic or an harmonic.

    The data sub classification in RFID systems includes, the security associated with the RFID systems, multi-tag read co-ordination and processing. In the similar context, public algorithm, proprietary algorithm or none are applied for the security associated with the RFID systems. The multi-tag read co-ordination techniques used in the latest RFID systems include SDMA, TDMA, FDMA and CDMA. The processing part is composed of the middleware which further has its own architecture which may assume a single or multi-tier shape and its associated location may be reader or the server.

    Basic Information: RFID tags are used in many industries, for example, an RFID tag attached to an automobile during production can be used to track its progress through the assembly line; RFID-tagged pharmaceuticals can be tracked through warehouses; and implanting RFID microchips in livestock and pets allows for positive identification of animals.

    Since RFID tags can be attached to cash, clothing, and possessions, or implanted in animals and people, the possibility of reading personally-linked information without consent has raised serious privacy concerns. These concerns resulted in standard specifications development addressing privacy and security issues. ISO/IEC 18000 and ISO/IEC 29167 use on-chip cryptography methods for untraceability, tag and reader authentication, and over-the-air privacy. ISO/IEC 20248 specifies a digital signature data structure for RFID and barcodes providing data, source and read method authenticity. This work is done within ISO/IEC JTC 1/SC 31 Automatic identification and data capture techniques.

    In 2014, the world RFID market is worth US$8.89 billion, up from US$7.77 billion in 2013 and US$6.96 billion in 2012. This includes tags, readers, and software/services for RFID cards, labels, fobs, and all other form factors. The market value is expected to rise to US$18.68 billion by 2026.

    What is RFID Radio Frequency Identification Meaning and Definition - ilearnlot


  • How to Explain the Different types of Data Mining Model?

    How to Explain the Different types of Data Mining Model?

    Learn, Explaining the Different types of Data Mining Model!


    Data Mining Models: Basically The data mining model are of two types. First Predictive and, Descriptive. Also learn, How to explain Organizational Culture? Meaning and Definition!

    Descriptive Models: The descriptive model identifies the patterns or relationships in data and explores the properties of the data examined. Ex. Clustering, Summarization, Association rule, Sequence discovery etc. Clustering is similar to classification except that the groups are not predefined, but are defined by the data alone. It is also referred to as unsupervised learning or segmentation. It is the partitioning or segmentation of the data in to groups or clusters. The clusters are defined by studying the behavior of the data by the domain experts.

    The term segmentation is used in very specific context; it is a process of partitioning of database into disjoint grouping of similar tuples. Summarization is the technique of presenting the summarize information from the data. The association rule finds the association between the different attributes. Association rule mining is a two step process: Finding all frequent item sets, Generating strong association rules from the frequent item sets. Sequence discovery is a process of finding the sequence patterns in data. This sequence can be used to understand the trend.

    Predictive Models: The predictive model makes prediction about unknown data values by using the known values. Ex. Classification, Regression, Time series analysis, Prediction etc. Many of the data mining applications are aimed to predict the future state of the data. Prediction is the process of analyzing the current and past states of the attribute and prediction of its future state. Classification is a technique of mapping the target data to the predefined groups or classes, this is a supervise learning because the classes are predefined before the examination of the target data.

    The regression involves the learning of function that map data item to real valued prediction variable. In the time series analysis the value of an attribute is examined as it varies over time. In time series analysis the distance measures are used to determine the similarity between different time series, the structure of the line is examined to determine its behavior and the historical time series plot is used to predict future values of the variable.

    Model Types Used by Data Mining Technologies


    The following represents a sampling of the types of modeling efforts possible using Nuggets the Data Mining Toolkit offered by Data Mining Technologies for the banking and Insurance Industries. Many other model types are used and we would be happy to discuss them in more detail if you contact us. Don’t forget to read it, The Importance Benefits of Corporate Retreats in Business!

    Claims Fraud Models

    The number of challenges facing the Property and Casualty insurance industry seems to have grown geometrically during the past decade. In the past, poor underwriting results and high loss ratio were compensated by excellent returns on investments. However, the performance of financial markets today is not sufficient to deliver the level of profitability that is necessary to support the traditional insurance business model. In order to survive in the bleak economic conditions that dictate the terms of today’s merciless and competitive market, insurers must change the way they operate to improve their underwriting results and profitability.

    An important element in the process of defining the strategies that are essential to ensure the success and profitable results of insurers is the ability to forecast the new directions in which claims management should be developed. This endeavor has become a crucial and challenging undertaking for the insurance industry, given the dramatic events of the past years in the insurance industry worldwide. We can check claims as they arrive and score them as to the likelihood of they are fraudulent. This can results in large savings to the insurance companies that use these technologies.

    Customer Clone Models

    The process for selectively targeting prospects for your acquisition efforts often utilizes a sophisticated analytical technique called “best customer cloning.” These models estimate which prospects are most likely to respond based on characteristics of the company’s “best customers”. To this end, we build the models or demographic profiles that allow you to select only the best prospects or “clones” for your acquisition programs. In a retail environment, we can even identify the best prospects that are close in proximity to your stores or distribution channels. Customer clone models are appropriate when insufficient response data is available, providing an effective prospect ranking mechanism when response models cannot be built.

    Response Models

    The best method for identifying the customers or prospects to target for a specific product offering is through the use of a model developed specifically to predict response. These models are used to identify the customers most likely to exhibit the behavior being targeted. Predictive response models allow organizations to find the patterns that separate their customer base so the organization can contact those customers or prospects most likely to take the desired action. These models contribute to more effective marketing by ranking the best candidates for a specific product offering thus identifying the low hanging fruit.

    Revenue and Profit Predictive Models

    Revenue and Profit Prediction models combine response/non-response likelihood with a revenue estimate, especially if order sizes, monthly billings, or margins differ widely. Not all responses have equal value, and a model that maximizes responses doesn’t necessarily maximize revenue or profit. Revenue and profit predictive models indicate those respondents who are most likely to add a higher revenue or profit margin with their response than other responders.

    These models use a scoring algorithm specifically calibrated to select revenue-producing customers and help identify the key characteristics that best identify better customers. They can be used to fine-tune standard response models or used in acquisition strategies.

    Cross-Sell and Up-Sell Models

    Cross-sell/up-sell models identify customers who are the best prospects for the purchase of additional products and services and for upgrading their existing products and services. The goal is to increase share of wallet. Revenue can increase immediately, but loyalty is enhanced as well due to increased customer involvement.

    Attrition Models

    Efficient, effective retention programs are critical in today’s competitive environment. While it is true that it is less costly to retain an existing customer than to acquire a new one, the fact is that all customers are not created equal. Attrition models enable you to identify customers who are likely to churn or switch to other providers thus allowing you to take appropriate preemptive action. When planning retention programs, it is essential to be able to identify best customers, how to optimize existing customers and how to build loyalty through “entanglement”. Attrition models are best employed when there are specific actions that the client can take to retard cancellation or cause the customer to become substantially more committed. The modeling technique provides an effective method for companies to identify characteristics of chumers for acquisition efforts and also to prevent or forestall cancellation of customers.

    Marketing Effectiveness Creative Models

    Often the message that is passed on to the customer is the one of the most important factors in the success of a campaign. Models can be developed to target each customer or prospect with the most effective message. In direct mail campaigns, this approach can be combined with response modeling to score each prospect with the likelihood they will respond given that they are given the most effective creative message (i.e. the one that is recommended by the model). In email campaigns this approach can be used to specify a customized creative message for each recipient.

    How to Explain the Different types of Data Mining Model - ilearnlot


  • What is Phases of the Data Mining Process?

    What is Phases of the Data Mining Process?

    What is Phases of the Data Mining Process?


    The Cross-Industry Standard Process for Data Mining (CRISP-DM) is the dominant data-mining process framework. It’s an open standard; anyone may use it. The following list describes the various phases of the process.

    Phases-of-the-Data-Mining-Process
    The Cross-Industry Standard Process for Data Mining

    Business understanding

    In the business understanding phase:

    First, it is required to understand business objectives clearly and find out what are the business’s needs.

    Next, we have to assess the current situation by finding of the resources, assumptions, constraints and other important factors which should be considered.

    Then, from the business objectives and current situations, we need to create data mining goals to achieve the business objectives within the current situation.

    Finally, a good data mining plan has to be established to achieve both business and data mining goals. The plan should be as detailed as possible.

    Data understanding

    First, the data understanding phase starts with initial data collection, which we collect from available data sources, to help us get familiar with the data. Some important activities must be performed including data load and data integration in order to make the data collection successfully.

    Next, the “gross” or “surface” properties of acquired data need to be examined carefully and reported.

    Then, the data needs to be explored by tackling the data mining questions, which can be addressed using querying, reporting, and visualization.

    Finally, the data quality must be examined by answering some important questions such as “Is the acquired data complete?”, “Is there any missing values in the acquired data?”

    Data preparation

    The data preparation typically consumes about 90% of the time of the project. The outcome of the data preparation phase is the final data set. Once available data sources are identified, they need to be selected, cleaned, constructed and formatted into the desired form. The data exploration task at a greater depth may be carried during this phase to notice the patterns based on business understanding.

    Modeling

    First, modeling techniques have to be selected to be used for the prepared dataset.

    Next, the test scenario must be generated to validate the quality and validity of the model.

    Then, one or more models are created by running the modeling tool on the prepared dataset.

    Finally, models need to be assessed carefully involving stakeholders to make sure that created models are met business initiatives.

    Evaluation

    In the evaluation phase, the model results must be evaluated in the context of business objectives in the first phase. In this phase, new business requirements may be raised due to the new patterns that have been discovered in the model results or from other factors. Gaining business understanding is an iterative process in data mining. The go or no-go decision must be made in this step to move to the deployment phase.

    Deployment

    The knowledge or information, which we gain through data mining process, needs to be presented in such a way that stakeholders can use it when they want it. Based on the business requirements, the deployment phase could be as simple as creating a report or as complex as a repeatable data mining process across the organization. In the deployment phase, the plans for deployment, maintenance, and monitoring have to be created for implementation and also future supports. From the project point of view, the final report of the project needs to summary the project experiences and review the project to see what need to improved created learned lessons.

    The CRISP-DM offers a uniform framework for experience documentation and guidelines. In addition, the CRISP-DM can apply in various industries with different types of data.

    In this article, you have learned about the data mining processes and examined the cross-industry standard process for data mining.

    Something is not Forgetting What? Data mining is a promising and relatively new technology. Data mining is defined as a process of discovering hidden valuable knowledge by analyzing large amounts of data, which is stored in databases or data warehouse, using various data mining techniques such as machine learning, artificial intelligence(AI) and statistical.

    Many organizations in various industries are taking advantages of data mining including manufacturing, marketing, chemical, aerospace… etc, to increase their business efficiency. Therefore, the needs for a standard data mining process increased dramatically. A data mining process must be reliable and it must be repeatable by business people with little or no knowledge of data mining background. As the result, in 1990, a cross-industry standard process for data mining (CRISP-DM) first published after going through a lot of workshops, and contributions from over 300 organizations.

    What-is-Phases-of-the-Data-Mining-Process


  • Process of The Data Mining

    Process of The Data Mining

    Process of The Data Mining


    Data mining is a promising and relatively new technology. Data mining is defined as a process of discovering hidden valuable knowledge by analyzing large amounts of data, which is stored in databases or data warehouse, using various data mining techniques such as machine learning, artificial intelligence(AI) and statistical.

    Many organizations in various industries are taking advantages of data mining including manufacturing, marketing, chemical, aerospace… etc, to increase their business efficiency. Therefore, the needs for a standard data mining process increased dramatically. A data mining process must be reliable and it must be repeatable by business people with little or no knowledge of data mining background. As the result, in 1990, a cross-industry standard process for data mining (CRISP-DM) first published after going through a lot of workshops, and contributions from over 300 organizations.

    The data mining process involves much hard work, including perhaps building data warehouse if the enterprise does not have one. A typical data mining process is likely to include the following steps:

    Requirements analysis: The enterprise decision makers need to formulate goals that the data mining process is expected to achieve. The business problem must be clearly defined. One cannot use data mining without a good idea of what kind of outcomes the enterprise is looking for, since the technique to be used and the data that is required are likely to be different for different goals. Furthermore, if the objectives have been clearly defined, it is easier to evaluate the results of the project. Once the goals have been agreed upon, the following further steps are needed.

    Data selection and collection: This step may include finding the best source databases for the data that is required. If the enterprise has implemented a data warehouse, then most of the data could be available there. If the data is not available in the warehouse or the enterprise does not have a warehouse, the source OLTP (On-line Transaction Processing) systems need to be identified and the required information extracted and stored in some temporary system. In some cases, only a sample of the data available may be required.

    Cleaning and preparing data: This may not be an onerous task if a data warehouse containing the required . data exists, since most of this must have already been done when data was loaded in the warehouse. Otherwise this task can be very resource intensive and sometimes more than 50% of effort in a data mining project is spent on this step. Essentially a data store that integrates data from a number of databases may need to be created. When integrating data, one often encounters problems like identifying data, dealing with missing data, data conflicts and ambiguity. An ETL (extraction, transformation and loading) tool may be used to overcome these problems.

    Data mining exploration and validation: Once appropriate data has been collected and cleaned, it is possible to start data mining exploration. Assuming that the user has access to one or more data mining tools, a data mining model may be constructed based on the enterprise’s needs. It may be possible to take a sample of data and apply a number of relevant techniques. For each technique the results should be evaluated and their significance interpreted. This is likely to be an iterative process which should lead to selection of one or more techniques that are suitable for further exploration, testing, and validation.

    Implementing, evaluating, and monitoring: Once a model has been selected and validated, the model can be implemented for use by the decision makers. This may involve software development for generating reports, or for results visualization and explanation for managers. It may be that more than one technique is available for the given data mining task. It is then important to evaluate the results and choose the best technique. Evaluation may involve checking the accuracy and effectiveness of the technique. Furthermore, there is a need for regular monitoring of the performance of the techniques that have been implemented. It is essential that use of the tools by the managers be monitored and results evaluated regularly. Every enterprise evolves with time and so must the data mining system. Therefore, monitoring is likely to lead from time to time to refinement of tools and techniques that have been implemented.

    Results visualization: Explaining the results of data mining to the decision makers is an important step of the data mining process. Most commercial data mining tools include data visualization modules. These tools are often vital in communicating the data mining results to the managers, although a problem dealing with a number of dimensions must be visualized using a two dimensional computer screen or printout. Clever data visualization tools are being developed to display results that deal with more than two dimensions. The visualization tools available should be tried and used if found effective for the given problem.

    Process-of-The-Data-Mining