Category: Technology

Technology – The collection of techniques, skills, methods, and procedures used in the production or production of goods or services, is the use of scientific knowledge for practical purposes, especially in the industry.

The technology has many effects. It has helped to develop more advanced economies (including today’s global economy) and allowed the rise of a holiday class. Many technical processes produce unwanted sub-products known as pollution and reduce natural resources to damage the Earth’s environment. Innovations have always influenced the values ​​of society and raised new questions about the ethics of technology. Examples include the rise of perception of efficiency in terms of human productivity and the challenges of bioethics.

  • What is Phases of the Data Mining Process?

    What is Phases of the Data Mining Process?

    What is Phases of the Data Mining Process?


    The Cross-Industry Standard Process for Data Mining (CRISP-DM) is the dominant data-mining process framework. It’s an open standard; anyone may use it. The following list describes the various phases of the process.

    Phases-of-the-Data-Mining-Process
    The Cross-Industry Standard Process for Data Mining

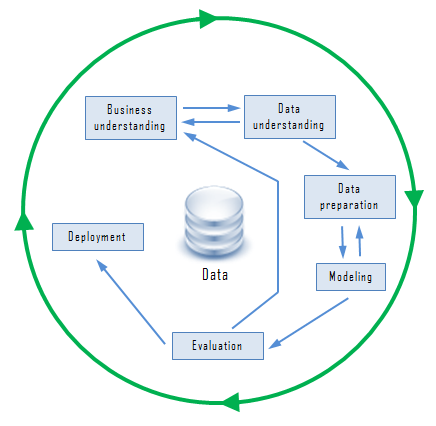
    Business understanding

    In the business understanding phase:

    First, it is required to understand business objectives clearly and find out what are the business’s needs.

    Next, we have to assess the current situation by finding of the resources, assumptions, constraints and other important factors which should be considered.

    Then, from the business objectives and current situations, we need to create data mining goals to achieve the business objectives within the current situation.

    Finally, a good data mining plan has to be established to achieve both business and data mining goals. The plan should be as detailed as possible.

    Data understanding

    First, the data understanding phase starts with initial data collection, which we collect from available data sources, to help us get familiar with the data. Some important activities must be performed including data load and data integration in order to make the data collection successfully.

    Next, the “gross” or “surface” properties of acquired data need to be examined carefully and reported.

    Then, the data needs to be explored by tackling the data mining questions, which can be addressed using querying, reporting, and visualization.

    Finally, the data quality must be examined by answering some important questions such as “Is the acquired data complete?”, “Is there any missing values in the acquired data?”

    Data preparation

    The data preparation typically consumes about 90% of the time of the project. The outcome of the data preparation phase is the final data set. Once available data sources are identified, they need to be selected, cleaned, constructed and formatted into the desired form. The data exploration task at a greater depth may be carried during this phase to notice the patterns based on business understanding.

    Modeling

    First, modeling techniques have to be selected to be used for the prepared dataset.

    Next, the test scenario must be generated to validate the quality and validity of the model.

    Then, one or more models are created by running the modeling tool on the prepared dataset.

    Finally, models need to be assessed carefully involving stakeholders to make sure that created models are met business initiatives.

    Evaluation

    In the evaluation phase, the model results must be evaluated in the context of business objectives in the first phase. In this phase, new business requirements may be raised due to the new patterns that have been discovered in the model results or from other factors. Gaining business understanding is an iterative process in data mining. The go or no-go decision must be made in this step to move to the deployment phase.

    Deployment

    The knowledge or information, which we gain through data mining process, needs to be presented in such a way that stakeholders can use it when they want it. Based on the business requirements, the deployment phase could be as simple as creating a report or as complex as a repeatable data mining process across the organization. In the deployment phase, the plans for deployment, maintenance, and monitoring have to be created for implementation and also future supports. From the project point of view, the final report of the project needs to summary the project experiences and review the project to see what need to improved created learned lessons.

    The CRISP-DM offers a uniform framework for experience documentation and guidelines. In addition, the CRISP-DM can apply in various industries with different types of data.

    In this article, you have learned about the data mining processes and examined the cross-industry standard process for data mining.

    Something is not Forgetting What? Data mining is a promising and relatively new technology. Data mining is defined as a process of discovering hidden valuable knowledge by analyzing large amounts of data, which is stored in databases or data warehouse, using various data mining techniques such as machine learning, artificial intelligence(AI) and statistical.

    Many organizations in various industries are taking advantages of data mining including manufacturing, marketing, chemical, aerospace… etc, to increase their business efficiency. Therefore, the needs for a standard data mining process increased dramatically. A data mining process must be reliable and it must be repeatable by business people with little or no knowledge of data mining background. As the result, in 1990, a cross-industry standard process for data mining (CRISP-DM) first published after going through a lot of workshops, and contributions from over 300 organizations.

    What-is-Phases-of-the-Data-Mining-Process


  • Process of The Data Mining

    Process of The Data Mining

    Process of The Data Mining


    Data mining is a promising and relatively new technology. Data mining is defined as a process of discovering hidden valuable knowledge by analyzing large amounts of data, which is stored in databases or data warehouse, using various data mining techniques such as machine learning, artificial intelligence(AI) and statistical.

    Many organizations in various industries are taking advantages of data mining including manufacturing, marketing, chemical, aerospace… etc, to increase their business efficiency. Therefore, the needs for a standard data mining process increased dramatically. A data mining process must be reliable and it must be repeatable by business people with little or no knowledge of data mining background. As the result, in 1990, a cross-industry standard process for data mining (CRISP-DM) first published after going through a lot of workshops, and contributions from over 300 organizations.

    The data mining process involves much hard work, including perhaps building data warehouse if the enterprise does not have one. A typical data mining process is likely to include the following steps:

    Requirements analysis: The enterprise decision makers need to formulate goals that the data mining process is expected to achieve. The business problem must be clearly defined. One cannot use data mining without a good idea of what kind of outcomes the enterprise is looking for, since the technique to be used and the data that is required are likely to be different for different goals. Furthermore, if the objectives have been clearly defined, it is easier to evaluate the results of the project. Once the goals have been agreed upon, the following further steps are needed.

    Data selection and collection: This step may include finding the best source databases for the data that is required. If the enterprise has implemented a data warehouse, then most of the data could be available there. If the data is not available in the warehouse or the enterprise does not have a warehouse, the source OLTP (On-line Transaction Processing) systems need to be identified and the required information extracted and stored in some temporary system. In some cases, only a sample of the data available may be required.

    Cleaning and preparing data: This may not be an onerous task if a data warehouse containing the required . data exists, since most of this must have already been done when data was loaded in the warehouse. Otherwise this task can be very resource intensive and sometimes more than 50% of effort in a data mining project is spent on this step. Essentially a data store that integrates data from a number of databases may need to be created. When integrating data, one often encounters problems like identifying data, dealing with missing data, data conflicts and ambiguity. An ETL (extraction, transformation and loading) tool may be used to overcome these problems.

    Data mining exploration and validation: Once appropriate data has been collected and cleaned, it is possible to start data mining exploration. Assuming that the user has access to one or more data mining tools, a data mining model may be constructed based on the enterprise’s needs. It may be possible to take a sample of data and apply a number of relevant techniques. For each technique the results should be evaluated and their significance interpreted. This is likely to be an iterative process which should lead to selection of one or more techniques that are suitable for further exploration, testing, and validation.

    Implementing, evaluating, and monitoring: Once a model has been selected and validated, the model can be implemented for use by the decision makers. This may involve software development for generating reports, or for results visualization and explanation for managers. It may be that more than one technique is available for the given data mining task. It is then important to evaluate the results and choose the best technique. Evaluation may involve checking the accuracy and effectiveness of the technique. Furthermore, there is a need for regular monitoring of the performance of the techniques that have been implemented. It is essential that use of the tools by the managers be monitored and results evaluated regularly. Every enterprise evolves with time and so must the data mining system. Therefore, monitoring is likely to lead from time to time to refinement of tools and techniques that have been implemented.

    Results visualization: Explaining the results of data mining to the decision makers is an important step of the data mining process. Most commercial data mining tools include data visualization modules. These tools are often vital in communicating the data mining results to the managers, although a problem dealing with a number of dimensions must be visualized using a two dimensional computer screen or printout. Clever data visualization tools are being developed to display results that deal with more than two dimensions. The visualization tools available should be tried and used if found effective for the given problem.

    Process-of-The-Data-Mining


  • Different Kind of Security Attacks on RFID Systems

    Different Kind of Security Attacks on RFID Systems

    Different Kind of Security Attacks on RFID Systems


    RFID systems are vulnerable to attack and can be compromised at various stages. Generally the attacks against a RFID system can be categorized into four major groups: attacks on authenticity, attacks on integrity, attacks on confidentiality, and attacks on availability. Besides being vulnerable to common attacks such as eavesdropping, man-in-the-middle and denial of service, RFID technology is, in particular, susceptible to spoof and power attacks.

    Meaning of RFID: “Radio-frequency identification (RFID) uses electromagnetic fields to automatically identify and track tags attached to objects. The tags contain electronically stored information. Passive tags collect energy from a nearby RFID reader’s interrogating radio waves. Active tags have a local power source such as a battery and may operate at hundreds of meters from the RFID reader. Unlike a barcode, the tag need not be within the line of sight of the reader, so it may be embedded in the tracked object. RFID is one method for Automatic Identification and Data Capture (AIDC).”

    This section illustrates the different kinds of attacks on RFID systems.

    Eavesdropping: Since an RFID tag is a wireless device that emits a unique identifier upon interrogation by a RFID reader, there exists a risk that the communication between tag and reader can be eavesdropped. Eavesdropping occurs when an attacker intercepts data with any compliant reader for the correct tag family and frequency while a tag is being read by an authorized RFID reader. Since most RFID systems use clear text communication due to tag memory capacity or cost, eavesdropping is a simple but efficient means for the attacker to obtain information on the collected tag data. The information picked up during the attack can have serious implications – used later in other attacks against the RFID system.

    Man-in-the-Middle Attack: Depending on the system configuration, a man-in-the-middle attack is possible while the data is in transit from one component to another. An attacker can interrupt the communication path and manipulate the information back and forth between RFID components. This is a real-time threat. The attack will reveal the information before the intended device receives it and can change the information en route. Even if it received some invalid data, the system being attacked might assume the problem was caused by network errors, but would not recognize that an attack occurred. An RFID system is particularly vulnerable to Man-in-the Middle attacks because the tags are small in size and low in price.

    Denial of Service: Denial of Service (DOS) attacks can take different forms to attack the RFID tag, the network, or the back-end to defeat the system. The purpose is not to steal or modify information, but to disable the RFID system so that it cannot be used. When talking about DOS attacks on wireless networks, the first concern is on physical layer attacks, such as jamming and interference. Jamming with noise signals can reduce the throughput of the network and ruin network connectivity to result in overall supply chain failure. A device that actively broadcasts radio signals can block and disrupt the operation of any nearby RFID readers. Interference with other radio transmitters is another possibility to prevent a reader from discovering and polling tags.

    Spoofing: In the context of RFID technology, spoofing is an activity whereby a forged tag masquerades as a valid tag and thereby gains an illegitimate advantage. Tag cloning is a kind of spoofing attack that captures the data from a valid tag, and then creates a copy of the captured sample with a blank tag.

    Replay Attack: In replay attack, an attacker intercepts communication between a RFID reader and a tag to capture a valid RFID signal. At a later time, this recorded signal is re-entered into the system when the attacker receives a query from the reader. Since the data appears valid, it will be accepted by the system.

    Virus: If a RFID tag is infected with a computer virus, this particular RFID virus could use SQL injection to attack the backend servers and eventually bring an entire RFID system down.

    Power Analysis: Power analysis is a form of side-channel attack, which intends to crack passwords through analyzing the changes of power consumption of a device. It has been proven that the power consumption patterns are different when the tag received correct and incorrect password bits.

    Impersonation: An adversary can query to a tag and a reader in RFID systems. By this property, one can impersonate the target tag or the legitimate reader. When a target tag communicates with a legitimate reader, an adversary can collect the messages being sent to the reader from the tag. With the message, the adversary makes a clone tag in which information of a target tag is stored. When the legitimate reader sends a query, the clone tag can reply the message in response, using the information of a target tag. Then the legitimate reader may consider the clone tag as a legitimate one.

    Information Leakage: If RFID systems are used widely, users will have various tagged objects. Some of objects such as expensive products and medicine store quite personal and sensitive information that the user does not want anyone to know. When tagged objects received a query from readers, the tags only emit its Electronic Product Code (EPC) to readers without checking legitimacy of readers. Therefore, if RFID systems are designed to protect the information of tags, user’s information cannot be leaked to malicious readers without an acknowledgment of the user.

    Traceability: When a user has special tagged objects, an adversary can trace user’s movement using messages transmitted by the tags. In the concrete, when a target tag transmits a response to a reader, an adversary can record the transmitted message and is able to establish a link between the response and the target tag. As the link is established, the adversary is able to know the user’s movement and obtain location history of the user.

    Tampering: The greatest threat for RFID system is represented by data tampering. The most well-known data tampering attacks control data, and the main defense against it is the control flow monitoring for reaching tamper-evidence. However, tampering with other kinds of data such as user identity data, configuration data, user input data, and decision-making data, is also dangerous. Some solutions were proposed, such as a tamper-evident compiler and micro-architecture collaboration framework to detect memory tampering. A further threat is the tampering with application data, involving mistakes in the production flow, denial of service, incoherence in the information system, and exposure to opponent attacks. This kind of attack is especially dangerous for RFID systems, since one of the main RFID applications is the automatic identification for database real-time updating.

    Different-Kind-of-Security-Attacks-on-RFID-Systems


  • The Different types of Data Mining Functionalities

    The Different types of Data Mining Functionalities

    Data mining functionalities are used to specify the kind of patterns to be found in data mining tasks. The Different types of Data Mining Functionalities.

    Data mining has an important place in today’s world. It becomes an important research area as there is a huge amount of data available in most of the applications. Data mining functionalities are used to specify the kind of patterns to be found in data mining tasks. Data mining tasks can be classified into two categories: descriptive and predictive. First Descriptive mining – tasks characterize the general properties of the data in the database, and second Predictive mining – tasks perform inference on the current data in order to make predictions. You’ll be studying The Different types of Data Mining Functionalities.

    This huge amount of data must be processed in order to extract useful information and knowledge since they are not explicit. Data Mining is the process of discovering interesting knowledge from a large amount of data. The kinds of patterns that can be discovered depend upon the data mining tasks employed. By and large, there are two types of data mining tasks: descriptive data mining tasks that describe the general properties of the existing data, and predictive data mining tasks that attempt to do predictions based on inference on available data.

    The data mining functionalities and the variety of knowledge they discover are briefly presented in the following list:

    Characterization: It is the summarization of general features of objects in a target class, and produces what is called characteristic rules. The data relevant to a user-specified class are normally retrieved by a database query and run through a summarization module to extract the essence of the data at different levels of abstractions.

    For example, one may wish to characterize the customers of a store who regularly rent more than movies a year. With concept hierarchies on the attributes describing the target class, the attribute-oriented induction method can be used to carry out data summarization. With a data cube containing summarization of data, simple OLAP operations fit the purpose of data characterization.

    Discrimination: Data discrimination produces what are called discriminant rules and is basically the comparison of the general features of objects between two classes referred to as the target class and the contrasting class.

    For example, one may wish to compare the general characteristics of the customers who rented more than 30 movies in the last year with those whose rental account is lower than. The techniques used for data discrimination are similar to the techniques used for data characterization with the exception that data discrimination results include comparative measures.

    Association analysis: Association analysis studies the frequency of items occurring together in transactional databases, and based on a threshold called support, identifies the frequent itemsets. Another threshold, confidence, which is the conditional probability that an item appears in a transaction when another item appears, is used to pinpoint association rules. This is commonly used for market basket analysis.

    For example, it could be useful for the manager to know what movies are often rented together or if there is a relationship between renting a certain type of movies and buying popcorn or pop. The discovered association rules are of the form: P→Q [s, c], where P and Q are conjunctions of attribute value-pairs, and s (support) is the probability that P and Q appear together in a transaction and c (confidence) is the conditional probability that Q appears in a transaction when P is present. For example, Rent Type (X,“game”)∧Age(X,“13-19”)→Buys(X,“pop”)[s=2%, =55%] The above rule would indicate that 2% of the transactions considered are of customers aged between 13 and 19 who are renting a game and buying a pop, and that there is a certainty of 55% that teenage customers who rent a game also buy pop.

    Classification: It is the organization of data in given classes. Classification uses given class labels to order the objects in the data collection. Classification approaches normally use a training set where all objects are already associated with known class labels. The classification algorithm learns from the training set and builds a model. The model is used to classify new objects.

    For example, after starting a credit policy, the manager of a store could analyze the customers’ behavior vis-à-vis their credit, and label accordingly the customers who received credits with three possible labels “safe”, “risky” and “very risky”. The classification analysis would generate a model that could be used to either accept or reject credit requests in the future.

    Prediction: Prediction has attracted considerable attention given the potential implications of successful forecasting in a business context. There are two major 50 types of predictions; one can either try to predict some unavailable data values or pending trends or predict a class label for some data. The latter is tied to classification. Once a classification model is built based on a training set, the class label of an object can be foreseen based on the attribute values of the object and the attribute values of the classes. Prediction is, however, more often referred to the forecast of missing numerical values, or increase/ decrease trends in time-related data. The major idea is to use a large number of past values to consider probable future values.

    Clustering: Similar to classification, clustering is the organization of data in classes. However, unlike classification, in clustering, class labels are unknown and it is up to the clustering algorithm to discover acceptable classes. Clustering is also called unsupervised classification because the classification is not dictated by given class labels. There are many clustering approaches all based on the principle of maximizing the similarity between objects in the same class (intra-class similarity) and minimizing the similarity between objects of different classes (inter-class similarity).

    Outlier analysis: Outliers are data elements that cannot be grouped in a given class or cluster. Also known as exceptions or surprises, they are often very important to identify. While outliers can be considered noise and discarded in some applications, they can reveal important knowledge in other domains, and thus can be very significant and their analysis valuable.

    Evolution and deviation analysis: Evolution and deviation analysis pertain to the study of time-related data that changes in time. Evolution analysis models evolutionary trends in data, which consent to characterize, comparing, classifying or clustering of time-related data. Deviation analysis, on the other hand, considers differences between measured values and expected values, and attempts to find the cause of the deviations from the anticipated values.

    It is common that users do not have a clear idea of the kind of patterns they can discover or need to discover from the data at hand. It is therefore important to have a versatile and inclusive data mining system that allows the discovery of different kinds of knowledge and at different levels of abstraction. This also makes interactivity an important attribute of a data mining system.

    Different-types-of-Data-Mining-Functionalities

  • What is Data Mining?

    What is Data Mining?

    What is Data Mining?


    Data mining involves the use of sophisticated data analysis tools to discover previously unknown, valid patterns and relationships in large data sets. These tools can include statistical models, mathematical algorithms, and machine learning methods such as neural networks or decision trees. Consequently, data mining consists of more than collecting and managing data, it also includes analysis and prediction. The objective of data mining is to identify valid, novel, potentially useful, and understandable correlations and patterns in existing data. Finding useful patterns in data is known by different names (e.g., knowledge extraction, information discovery, information harvesting, data archaeology, and data pattern processing).

    The term “data mining” is primarily used by statisticians, database researchers, and the business communities. The term KDD (Knowledge Discovery in Databases) refers to the overall process of discovering useful knowledge from data, where data mining is a particular step in this process. The steps in the KDD process, such as data preparation, data selection, data cleaning, and proper interpretation of the results of the data mining process, ensure that useful knowledge is derived from the data. Data mining is an extension of traditional data analysis and statistical approaches as it incorporates analytical techniques drawn from various disciplines like AI, machine learning, OLAP, data visualization, etc.

    Data Mining covers variety of techniques to identify nuggets of information or decision-making knowledge in bodies of data, and extracting these in such a way that they can be. Put to use in the areas such as decision support, prediction, forecasting and estimation. The data is often voluminous, but as it stands of low value as no direct use can be made of it; it is the hidden information in the data that is really useful. Data mining encompasses a number of different technical approaches, such as clustering, data summarization, learning classification rules, finding dependency net works, analyzing changes, and detecting anomalies. Data mining is the analysis of data and the use of software techniques for finding patterns and regularities in sets of data. The computer is responsible for finding the patterns by identifying the underlying rules and features in the data. It is possible to ‘strike gold’ in unexpected places as the data mining software extracts patterns not previously discernible or so obvious that no-one has noticed them before. In Data Mining, large volumes of data are sifted in an attempt to find something worthwhile.

    Data mining plays a leading role in the every facet of Business. It is one of the ways by which a company can gain competitive advantage. Through application of Data mining, one can tum large volumes of data collected from various front-end systems like Transaction Processing Systems, ERP, and operational CRM into meaningful knowledge.

    “Data mining is the computing process of discovering patterns in large data sets involving methods at the intersection of machine learning, statistics, and database systems. It is an interdisciplinary subfield of computer science. The overall goal of the data mining process is to extract information from a data set and transform it into an understandable structure for further use. Aside from the raw analysis step, it involves database and data management aspects, data pre-processing, model and inference considerations, interestingness metrics, complexity considerations, post-processing of discovered structures, visualization, and online updating. Data mining is the analysis step of the “knowledge discovery in databases” process, or KDD.”

    Data Mining History and Current Advances

    The process of digging through data to discover hidden connections and predict future trends has a long history. Sometimes referred to as “knowledge discovery in databases,” the term “data mining” wasn’t coined until the 1990s. But its foundation comprises three intertwined scientific disciplines: statistics (the numeric study of data relationships), artificial intelligence (human-like intelligence displayed by software and/or machines) and machine learning (algorithms that can learn from data to make predictions). What was old is new again, as data mining technology keeps evolving to keep pace with the limitless potential of big data and affordable computing power.

    Over the last decade, advances in processing power and speed have enabled us to move beyond manual, tedious and time-consuming practices to quick, easy and automated data analysis. The more complex the data sets collected, the more potential there is to uncover relevant insights. Retailers, banks, manufacturers, telecommunications providers and insurers, among others, are using data mining to discover relationships among everything from pricing, promotions and demographics to how the economy, risk, competition and social media are affecting their business models, revenues, operations and customer relationships.

    Who’s using it?

    Data mining is at the heart of analytics efforts across a variety of industries and disciplines.

    Communications: In an overloaded market where competition is tight, the answers are often within your consumer data. Multimedia and telecommunications companies can use analytic models to make sense of mountains of customers data, helping them predict customer behavior and offer highly targeted and relevant campaigns.

    Insurance: With analytic know-how, insurance companies can solve complex problems concerning fraud, compliance, risk management and customer attrition. Companies have used data mining techniques to price products more effectively across business lines and find new ways to offer competitive products to their existing customer base.

    Education: With unified, data-driven views of student progress, educators can predict student performance before they set foot in the classroom – and develop intervention strategies to keep them on course. Data mining helps educators access student data, predict achievement levels and pinpoint students or groups of students in need of extra attention.

    Manufacturing: Aligning supply plans with demand forecasts is essential, as is early detection of problems, quality assurance and investment in brand equity. Manufacturers can predict wear of production assets and anticipate maintenance, which can maximize uptime and keep the production line on schedule.

    Banking: Automated algorithms help banks understand their customer base as well as the billions of transactions at the heart of the financial system. Data mining helps financial services companies get a better view of market risks, detect fraud faster, manage regulatory compliance obligations and get optimal returns on their marketing investments.

    Retail: Large customer databases hold hidden insights that can help you improve customer relationships, optimize marketing campaigns and forecast sales. Through more accurate data models, retail companies can offer more targeted campaigns – and find the offer that makes the biggest impact on the customer.

    What-is-Data-Mining